


 24 / 35

22
/
PEOPLE
Disparidade no ganho médio mensal por NUTS II, 2013
Disparity in mean monthly earning by region, 2013
Fonte/
Source
Ministério da Economia, Quadros de Pessoal
Ministry of Economy, Lists of personnel
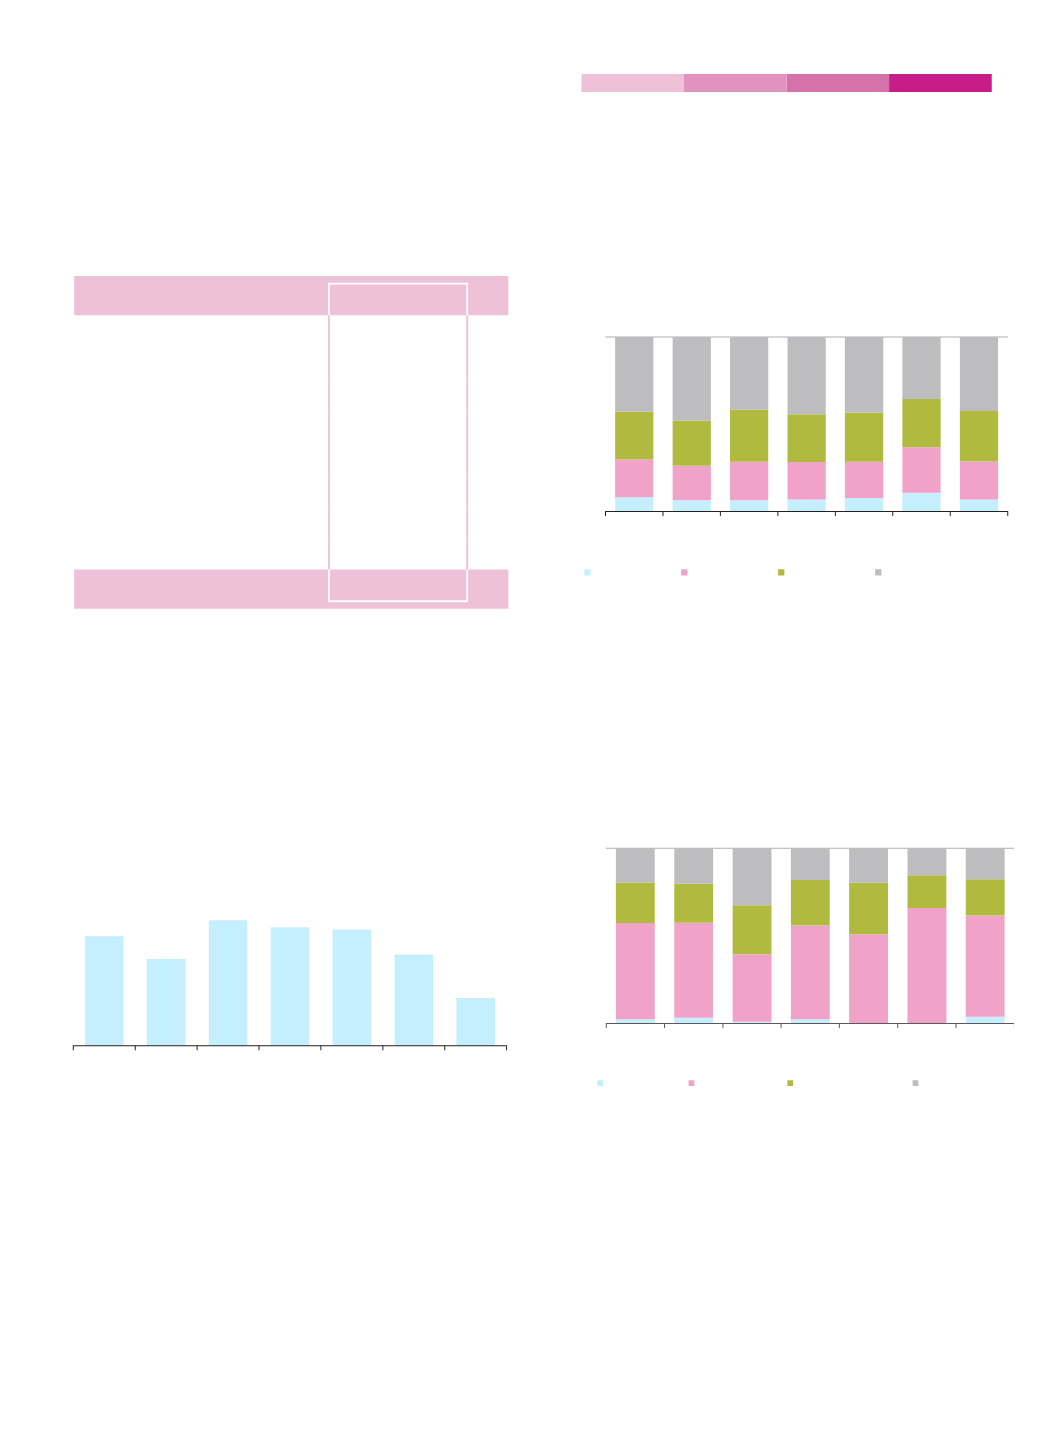
Duração média habitual do horário semanal por NUTS II, 2014
Average duration of weekly working time by region, 2014
Fonte/
Source
INE, I.P., Inquérito ao Emprego
Statistics Portugal - Labour Force Survey
%
Portugal
x
Norte
10,8
Centro
11,7
A.M. Lisboa
12,2
Alentejo
13,7
Algarve
9,1
R. A. Açores
x
R. A. Madeira
11,9
%
39,8
38,8
40,5
40,2
40,1
39,0
37,1
Norte
Centro
A. M.
Lisboa
Alentejo Algarve
R. A.
Açores
R. A.
Madeira
hora/hour
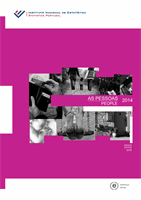
8% 6% 6% 7% 8% 11% 7%
22% 20% 22% 21% 21%
26%
22%
28% 26% 30% 27% 28%
28%
29%
43% 48% 42% 44% 43% 36% 42%
0%
100%
Norte Centro A. M.
Lisboa
Alentejo Algarve R. A.
Açores
R. A.
Madeira
15-24 anos
15-24 years
25-34 anos
25-34 years
35-44 anos
35-44 years
45 e+ anos
45 years and over
2%
3%
1%
2%
4%
55%
54%
38%
54%
50%
64%
58%
23%
22%
28%
26%
29%
18%
21%
20%
20%
33%
18%
19%
15%
18%
0%
100%
Norte Centro A. M.
Lisboa
Alentejo Algarve R. A.
Açores
R. A.
Madeira
Sem instrução
Uneducated
Básico
Basic education
Secundário
Secondary education
Superior
Higher education
Distribuição percentual da população ativa segundo o grupo
etário por NUTS II, 2014
Percent distribution of active population according to age
group by region, 2014
Fonte/
Source
INE, I.P., Inquérito ao Emprego
Statistics Portugal - Labour Force Survey
Distribuição percentual da população ativa segundo o nível
de escolaridade completo por NUTS II, 2014
Percent distribution of active population according to
educational level completed by region, 2014
Fonte/
Source
INE, I.P., Inquérito ao Emprego
Statistics Portugal - Labour Force Survey