


 35 / 38

[35]
Turismo
Tourism
2013
2005
Portugal
España
2006 2007
4,6
0,5
3,9
4,5
0,1
2,2
0,3
1,7
2008 2009
3,5
2,6
-0,1
3,1
%
Taxa de crescimento das camas em estabelecimentos hoteleiros, 2005-2014
Number of bed-places in hotels and similar accommodation , 2005-2014
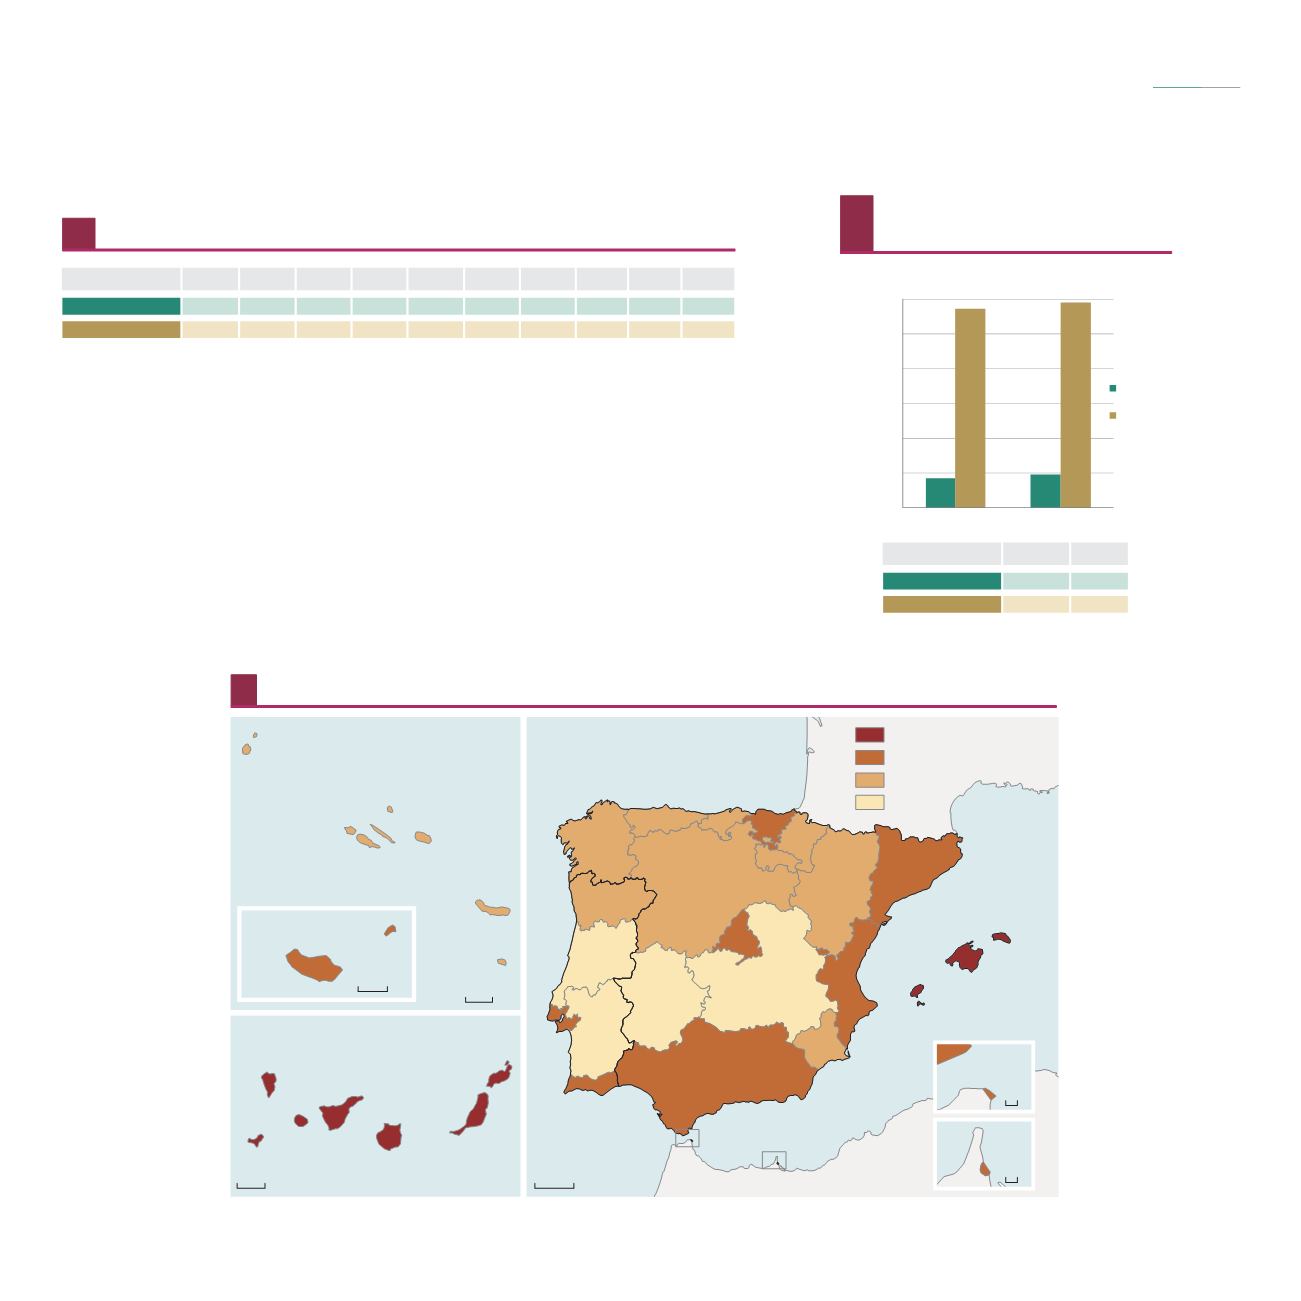
1
Dormidas em estabelecimentos hoteleiros,
2013-2014
Nights spent in hotels and similar accommodation,
2013-2014
107
106
2010
2,1
2,8
2011
3,4
3,0
2012
2,5
1,1
2013 2014
Portugal
España
42 507
286 030
47 450
295 261
milhares
/
thousand
milhares
/
thousand
Portugal
España
0
50 000
100 000
150 000
200 000
250 000
300 000
2013
2014
108
Taxa de ocupação-cama dos estabelecimentos hoteleiros, 2014 (%)
/
Use of bed-places net in hotels and similar establishments, 2014 (%)
2014
4,7
0,4
60 - 75
45 - 60
30 - 45
25 - 30
R. A. Açores
R. A. Madeira
Canárias
Ceuta
Melilla
0
50km
0
50km
0
25km
0
100km
0 5 km
0 5 km
Península Ibérica
The Iberian Peninsula
em números
2015
in figures
Índice
Index
Fonte
/
Source
: Eurostat
Fonte
/
Source
: Eurostat
Fonte: Dados nacionais
/
Source: National data
1
Change over previous period