


 27 / 38

[27]
Indústria, Construção e Energia
Industry, Construction and Energy
0-9
10-19 20-49 50-249
≥
250
Portugal
España
3,7%
2,5%
1,6%
1,0%
0,6%
0,3%
0,1%
0,0%
94,1%
96,2%
2013
1000 € por empregado
1000 € per employee
UE/EU 28
ES
BE
NL
DK
SE
AT
UK
LU
DE
FR
IT
EL
SI
CY
(:)
53,6
95,7
84,8
82,9
82,8
76,9
72,1
70,8
67,9
64,2
53,2
35,6
33,3
28,0
HU
CZ
EE
PO
SK
HR
LV
LT
RO
BG
IE
MT
FI
PT
28,0
25,9
23,7
23,2
22,8
17,4
15,6
14,5
12,0
9,1
(:)
(:)
(:)
26,2
Produtividade aparente (VAB cf/emprego) da
Indústria transformadora, 2013
Apparent labour productivity (GVA fc/employement)
in Manufacturing, 2013
75
Empresas de Construção por número de empregados, 2013
Construction enterprises by number of employees, 2013
76
2014
%
UE/EU 28
PT
CZ
SK
SL
PL
HU
EE
BG
RO
DE
HR
IT
AT
LT
24,4
24,9
38,3
35,5
31,5
30,8
30,5
30,5
30,3
30,1
28,3
27,2
27,1
26,1
24,8
LV
FI
MT
BE
FR
DK
UK
SE
IE
CY
EL
NL
LU
ES
24,1
22,0
21,6
21,5
20,6
19,3
18,9
18,7
18,5
16,5
15,1
15,0
10,8
19,5
População empregada na Indústria , 2014
(1)(2)
Employment in Industry , 2014
(1)(2)
77
Fonte
/
: Eurostat
Source
1
2
/
Os dados referem-se à % da população empregada na Indústria relativamente
ao total da população empregada (15 - 64 anos).
Engloba as seções B a F da NACE Rev.2.
Data refer to employement in Industry related to total employement
(persons aged 15-64)
Including sections B to F of NACE Rev. 2.
2014
%
UE/EU 28
CZ
SI
RO
HU
DE
SK
PO
LT
BG
IE
AT
EE
HR
FI
18,9
32,4
27,4
27,3
26,8
25,7
25,3
25,0
23,0
22,7
22,7
21,7
21,6
21,1
20,3
SE
IT
DK
NL
LV
BG
UK
FR
EL
MT
CY
LU
PT
ES
20,0
18,6
18,0
16,7
16,5
16,5
14,7
13,8
12,8
11,7
8,0
6,1
17,1
17,0
Fonte
Dado não disponível
/
: Eurostat
(:)
/
Source
Not available
1
/
Excluindo a Construção
Excluding Construction
Proporção do VAB a preços base do setor da Indústria
transformadora no total do VAB a preços base, 2014
1
GVA at basic prices in Manufacturing related to total
GVA at basic prices, 2014
1
78
79
2005
2006
2007
2008
2009
2010
2011
2012
Portugal
1
España
2
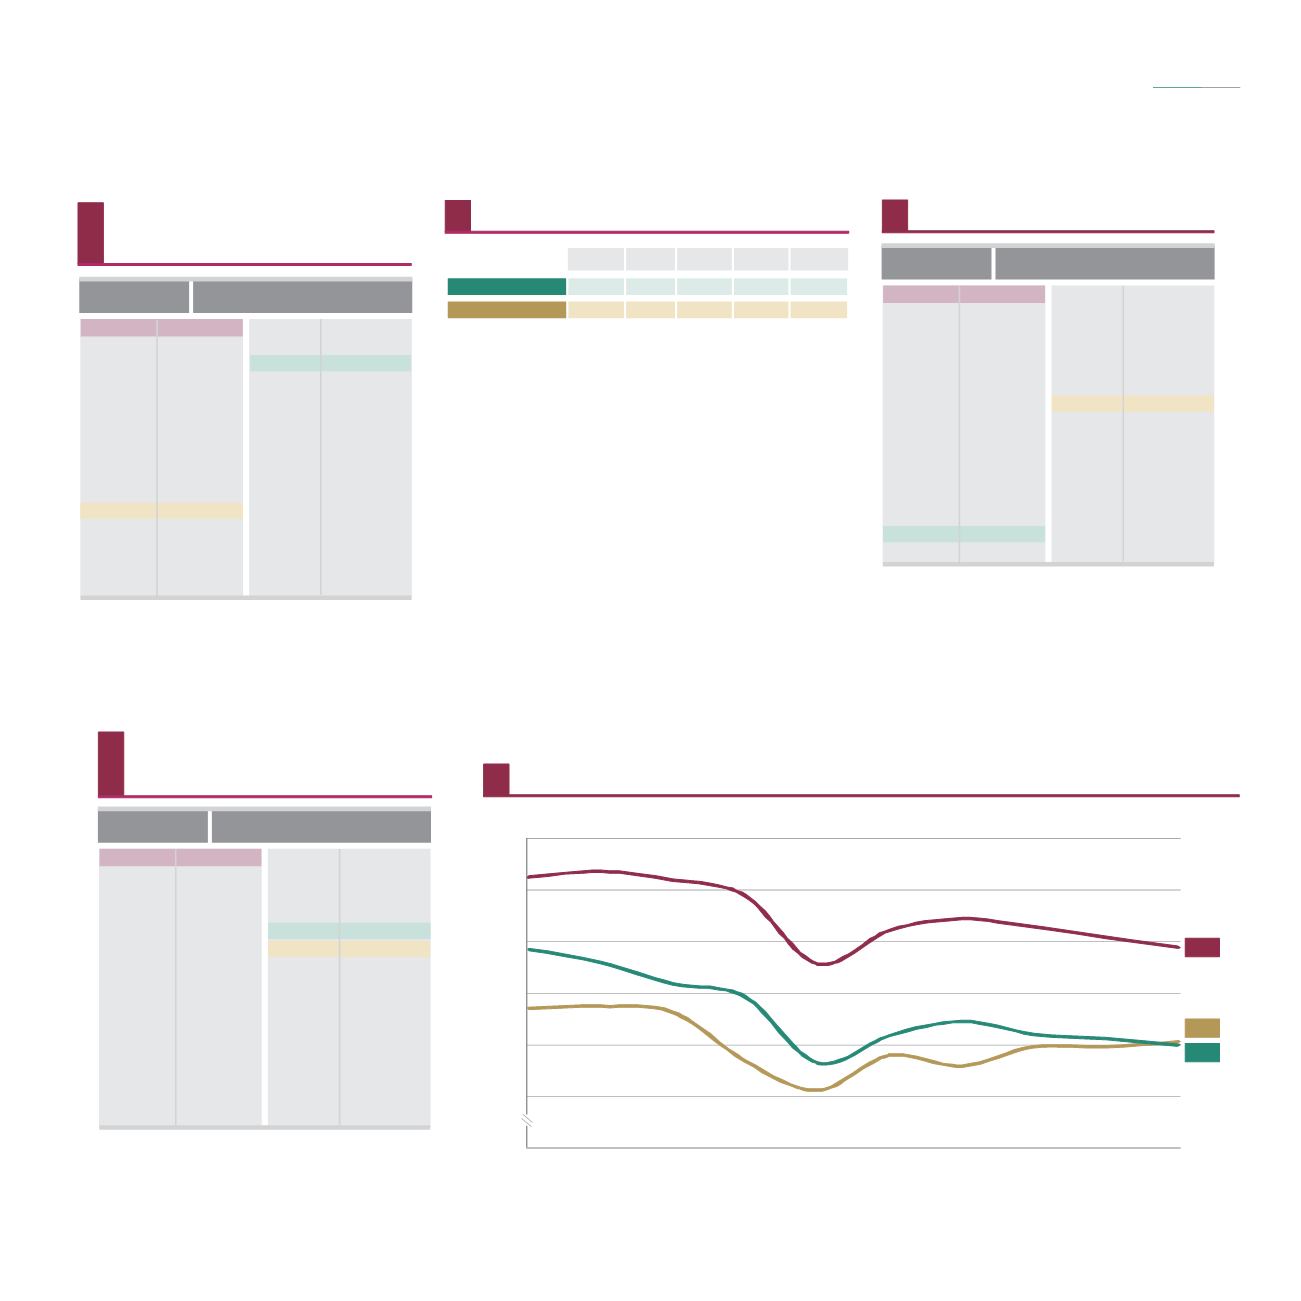
Proporção do VAB a preços base do setor da Indústria transformadora no total do VAB a preços base, 2005-2014
1
GVA at basic prices in Manufacturing related to total GVA at basic prices, 2005-2014
1
16,0
17,0
18,0
19,0
20,0
21,0
%
UE/ 28
EU
18,9
17,1
17,0
2013
2014
Fonte
/
: Eurostat
Source
1
2
/
/
Dado estimado para 2014
Dados provisórios para toda a série
2014: Estimated
All data provisional
Península Ibérica
The Iberian Peninsula
em números
2015
in figures
Índice
Index
Fonte
/
Source
: Eurostat
(:)
/
Dado não disponível
Not available
Fonte
/
: Eurostat
Source