


 14 / 58

12
/
PORTUGAL IN FIGURES
Esperança de vida
Life expectancy
Homens
Mulheres
Homens
Mulheres
Esperança de vida à nascença
Esperança de vida aos 65 anos
2004 - 2006
74,81
81,33
16,02
19,42
2005 - 2007
75,18
81,63
16,16
19,55
2006 - 2008
75,49
81,81
16,35
19,7
2007 - 2009
75,84
81,87
16,48
19,74
2008 - 2010
76,17
82,19
16,74
20,03
2009 - 2011
76,47
82,43
16,92
20,2
2010 - 2012
76,67
82,59
16,94
20,27
2011 - 2013
76,91
82,79
17,07
20,4
Life expectancy at birth
Life expectancy at 65 years
males
Females
males
Females
Fonte/
Source
INE, I.P, Tábuas Completas de Mortalidade, Esperança de vida à nascença; Esperança de vida
aos 65 anos.
Statistics Portugal, Complete life tables, Life expectancy at birth; Life expectancy at 65 years.
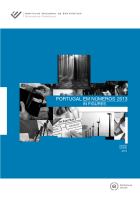
Indicadores de População
Population indicators
Fonte/
Source
INE, I.P., Estimativas Definitivas da População Residente 1991-2010 e Estimativas Provisórias
da População Residente 2011-2013.
Statistics Portugal,Final Resident Population Estimates 1991-2010 and Provisional Estimates
of Resident Population 2011-2013.
A população
residente
em
Portugal,
no final do
ano
de
2013
,
foi
estimada
em
10 427 301
The estimated resident
population in portugal was
10,427,301 at the end of 2013