


 16 / 58

14
/
PORTUGAL IN FIGURES
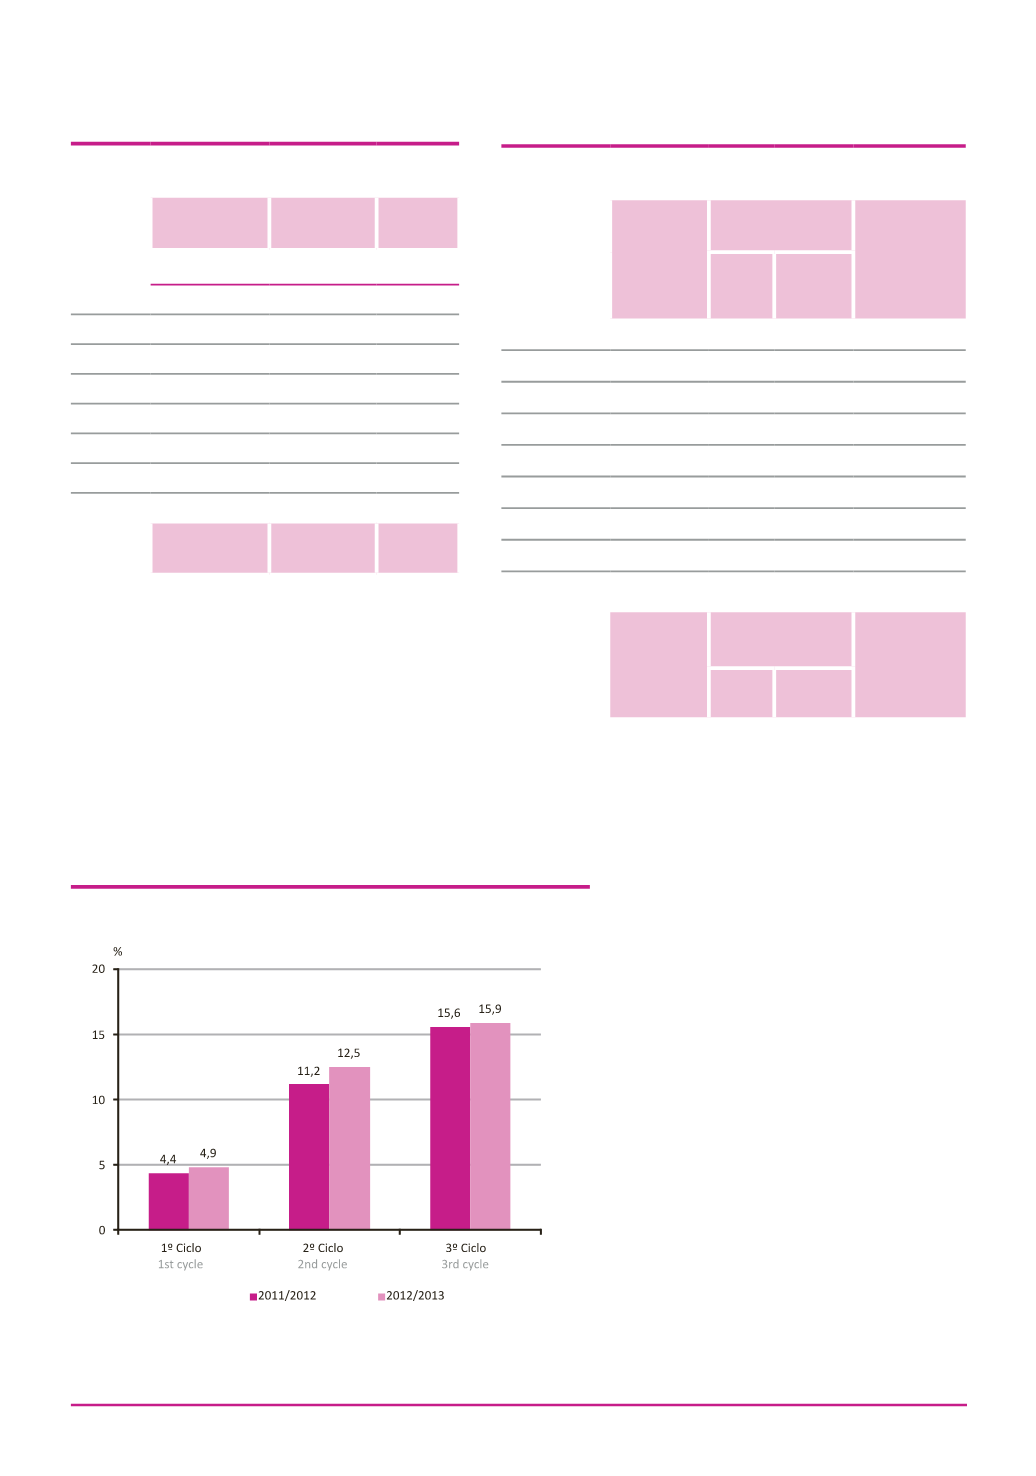
The school retention and desistance
rate in primary and lower secundary
education stood at 10.4% en
2012/2013
A taxa de retenção e
desistência
no ensino básico
situou-se em
10,4
%
no
ano letivo
2012/2013
Taxa de retenção e desistência no ensino básico
Retention and desistance rate at basic education
Fonte/
Source
MinistériodaEducaçãoeCiência -Direção-GeraldeEstatísticasdaEducaçãoeCiência.
Ministry of Education and Science - Directorate-General for Education and
Science Statistics.
Ensino superior
Tertiary education
Estabelecimentos
de ensino
Alunas/os
matriculadas/os
Pessoal
docente
N.
o
/
No.
2005/06
326
367 312
37 434
2006/07
319
366 729
36 069
2007/08
305
376 917
35 178
2008/09
301
373 002
35 380
2009/10
296
383 627
36 215
2010/11
300
396 268
38 064
2011/12
300
390 273
37078
2012/13
298
371 000
35 482
Educational
institutions
Students
enrolled
Teaching
staff
Fonte/
Source
Ministério da Educação e Ciência - Direção-Geral de Estatísticas
da Educação e Ciência.
Ministry of Education and Science - Directorate-General for
Education and Science Statistics.
2012/2013
Taxa de escolarização
Educational attainment rate
Taxa bruta
de pré-
escolarização
Taxa bruta de
escolarização
Taxa de
escolarização no
ensino superior
(alunas/os com
idade entre 18 e
22 anos)
Ensino
básico
Ensino
secundário
Portugal
90,6 112,6
121,0
32,2
Continente
90,4 112,6
122,0
33,8
Norte
94,9 110,6
118,1
28,8
Centro
96,4 110,2
118,8
36,2
Lisboa
81,4 116,7
132,8
45,2
Alentejo
100,9 113,2
117,3
19,6
Algarve
80,9 114,0
118,4
18,1
R. A. Açores
92,1 112,5
96,0
9,1
R. A. Madeira
94,0 112,5
114,5
9,1
Pre-primary
crude
educational
attainment rate
Crude educational
attainment rate
Enrolment rate in
higher education
(students aged
between 18 and
22 years old)
Basic
education
Secundary
education
Fonte/
Source
Ministério da Educação e Ciência - Direção-Geral de Estatísticas da Educação
e Ciência.
Ministry of Education and Science - Directorate-General for Education and
Science Statistics.