


 36 / 58

34
/
PORTUGAL IN FIGURES
2013
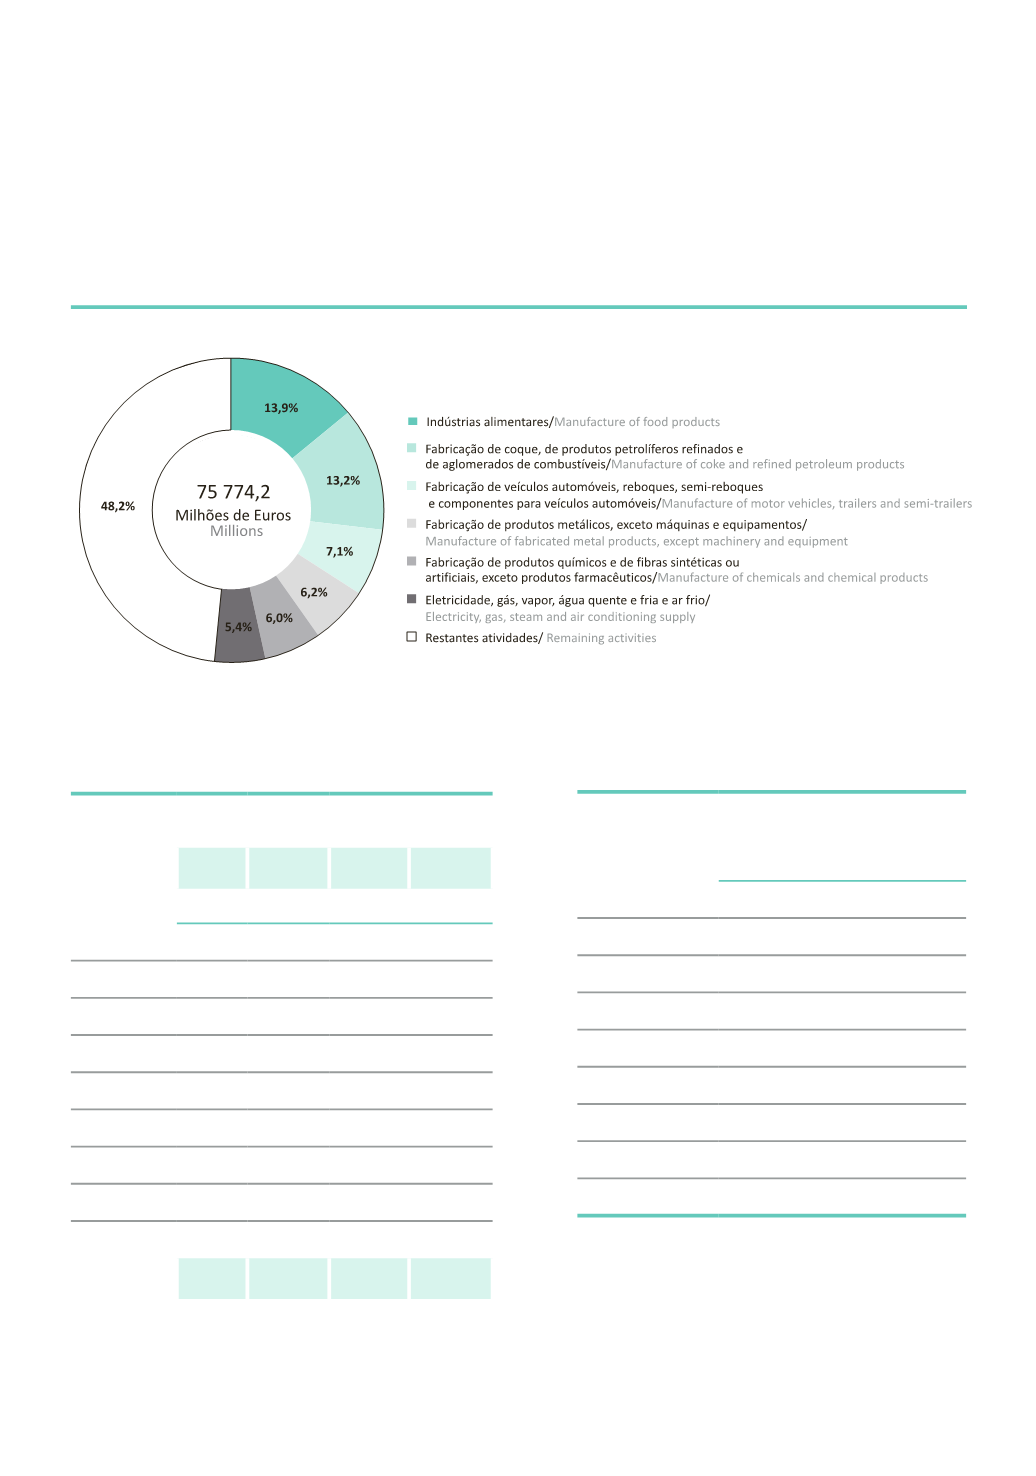
Peso das principais divisões de atividade no total das vendas de produtos e prestação de serviços
Weight of the main activities on the total sales of products and services
Fonte/
Source
INE, IP., Inquérito anual à produção industrial.
Statistics Portugal, Annual Survey on Industrial Production (Prodcom Survey).
INDUSTRIA E ENERGIA
INDUSTRY E ENERGY
>
61
2012 Po
Consumo de combustível automóvel por habitante
Car fuel consumption per inhabitant
tep /
toe
Portugal
0,5
Continente
0,5
Norte
0,5
Centro
0,6
Lisboa
0,5
Alentejo
0,6
Algarve
0,5
R. A. Açores
0,6
R. A. Madeira
0,4
Fonte/
Source
Direção-Geral de Energia e Geologia (DGEG).
Directorate-General for Energy and Geology (DGEG).
2012 Po
Consumo de energia elétrica por consumidor
Electricity consumption per consumer
Total
Doméstico Indústria Agricultura
kWh
Portugal
7 380,4 2 394,7 189 707,0 8 077,0
Continente
7 437,6 2 398,6 193 553,7 8 061,8
Norte
7 133,3 2 647,6 143 136,9 3 859,5
Centro
7 764,8 2 133,0 224 269,6 5 597,2
Lisboa
7 581,8 2 299,9 308 842,9 20 880,9
Alentejo 8 995,6 2 451,9 225 312,1 19 426,1
Algarve
5 301,5 2 500,9 45 928,0 8 898,6
R.A. Açores
6 030,1 2 437,5 86 062,7 17 689,6
R.A. Madeira 6 024,0 2 182,2 61 791,7 3 843,1
Total
Residential
Industry Agriculture
Fonte/
Source
Ministério do Ambiente, Ordenamento do Território e Energia -
Direção-Geral de Energia e Geologia (DGEG).
Ministry for Environment, Spatial Planning and Energy - Directorate-
General for Energy and Geology (DGEG).