


 20 / 38

[20]
Mercado de Trabalho
Labour Market
2014
N.º horas
No. hours
UE/EU 28
PT
ES
EL
AT
UK
CY
PL
SI
CZ
SK
DE
BE
MT
BG
41,5
42,8
41,6
44,2
43,0
42,9
42,4
42,4
41,9
41,8
41,7
41,5
41,4
41,3
41,2
HR
HU
NL
EE
LU
SE
FR
IT
LV
RO
IE
FI
LT
DK
41,2
40,9
40,9
40,8
40,8
40,8
40,5
40,5
40,5
40,4
40,3
40,0
39,5
38,8
Horas trabalhadas a tempo inteiro, 2014
1
Work hours in full time, 2014
1
49
2014
%
2
UE/EU 28
ES
NL
AT
DE
UK
SE
DK
BE
IE
FR
LU
IT
MT
FI
20,5
15,9
50,6
27,9
27,6
26,8
26,2
25,5
24,1
23,5
18,9
18,9
18,4
16,5
15,4
CY
SI
RO
EE
EL
LT
PL
LV
CZ
HU
HR
SK
BG
PT
14,1
11,2
10,0
9,6
9,5
9,1
7,8
7,4
6,4
6,4
6,2
5,2
2,7
13,1
População empregada a tempo parcial, 2014
1
Part-time workers , 2014
1
50
Horas trabalhadas a tempo parcial , 2014
1
Work hours in part-time , 2014
1
51
20,4
18,6
17,0
25,0
24,0
23,3
22,8
22,7
22,6
21,4
21,3
21,3
21,1
20,9
20,6
20,5
20,0
20,0
19,9
19,8
19,7
19,6
19,5
19,5
19,5
19,4
19,3
19,1
19,1
19,0
18,6
16,1
25,2
23,6
22,7
21,8
21,4
21,4
21,3
21,2
21,2
20,9
20,8
20,7
20,5
20,2
20,2
20,0
19,9
19,5
19,2
18,7
18,5
18,5
18,1
17,8
16,5
15,2
UE/EU 28
ES
PT
SE
BE
FR
HU
LU
RO
PL
CZ
MT
IT
AT
EE
LT
EL
NL
LV
CY
FI
HR
BG
SI
SK
DE
UK
DK
IE
UE/EU 28
ES
PT
RO
BE
HU
MT
LV
PL
FR
HR
IT
CZ
SE
CY
BG
IE
LT
EE
EL
LU
SK
UK
NL
SI
AT
FI
DE
DK
N.º horas/
No. hours
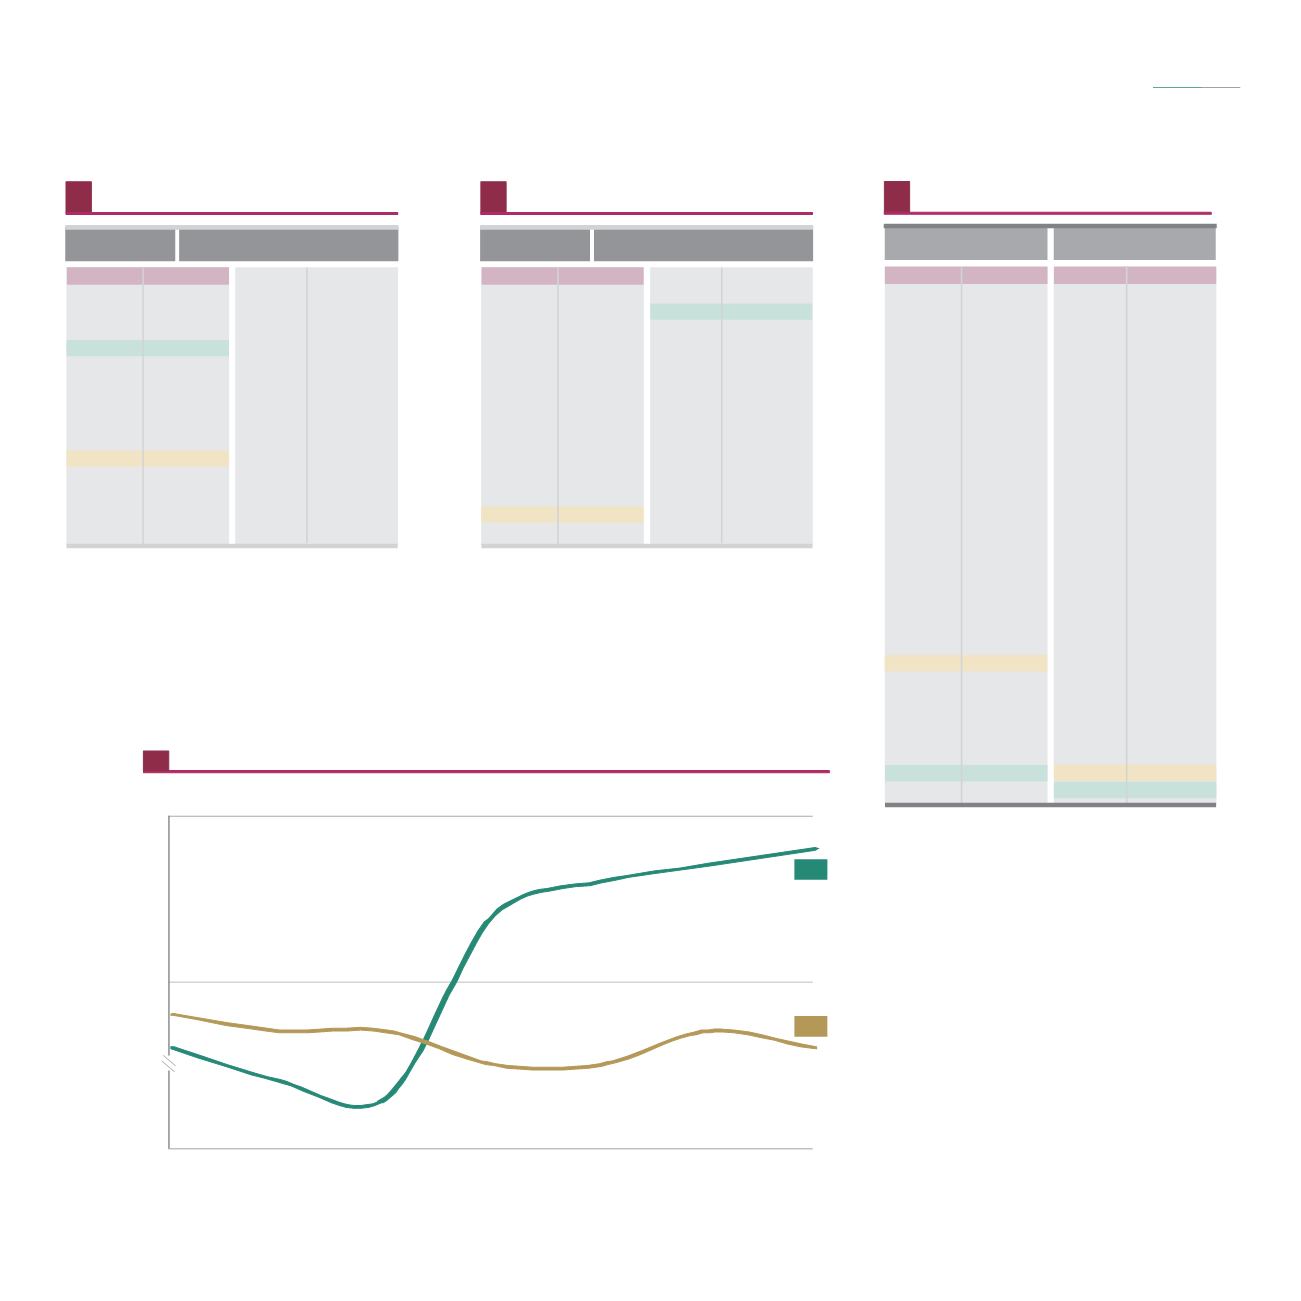
Horas trabalhadas a tempo inteiro , 2008-2014
1
/
Work hours in full time , 2008-2014
1
52
Fonte
/
: Eurostat
Source
1
Número médio de horas habitualmente trabalhadas por semana
Average number of usual weekly hours of work
Fonte
/
: Eurostat
Source
1
2
/
/
Grupo etário 15-64 anos
Relativamente ao total de empregados
Population aged 15-64
Related to total employment
Fonte
/
: Eurostat
Source
1
Número médio de horas habitualmente trabalhadas por semana
Average number of usual weekly hours of work
Fonte
/
: Eurostat
Source
1
2
3
/
/
Número médio de horas habitualmente trabalhadas por semana
Quebra de série em 2008 e 2009
Quebra de série em 2008 e 2011
Average number of usual weekly hours of work
2008 and 2009: Break in time series
2008 and 2011: Break in time series
Península Ibérica
The Iberian Peninsula
em números
2015
in figures
Índice
Index
Homens
/ Male
Mulheres
/ Female
42,8
41,6
41
42
2008
2009
2010
2011
2012
2014
España
2
Portugal
3
2013