


 25 / 38

[25]
França
Alemanha
Itália
EUA
Países Baixos
Marrocos
Turquia
/
/
Portugal
/
/
/
/
/
/
/
France
Germany
Italy
United Kingdom
United States
Netherlands
Belgium
Morocco
Turkey
Reino Unido
Bélgica
Alemanha
França
Itália
Países Baixos
Argélia
EUA
Bélgica
/
/
China
/
/
/
/
/
/
Germany
France
Italy
Netherlands
United Kingdom
Algeria
United States
Belgium
Portugal
Reino Unido
15,8
10,4
7,4
7,1
6,9
4,3
3,1
2,5
2,4
2,1
13,3
11,8
6,1
6,1
4,8
4,4
3,9
3,4
3,2
3,2
1º
2º
3º
4º
5º
6º
7º
8º
9º
10º
1º
2º
3º
4º
5º
6º
7º
8º
9º
10º
Exportações
Export
%
%
Espanha
França
Alemanha
Reino Unido
EUA
Países Baixos
Itália
/
/
/
Angola
/
/
/
/
China
Spain
France
Germany
United Kingdom
United States
Netherlands
Italy
/
Bélgica
Belgium
1º
2º
3º
4º
5º
6º
7º
8º
9º
10º
23,6
11,7
11,7
6,6
6,1
4,4
4,0
3,3
2,7
1,7
Espanha
Alemanha
França
Itália
Países Baixos
Reino Unido
Bélgica
EUA
/
/
/
/
/
/
Angola
China
/
/
Spain
Germany
France
Italy
Netherlands
United Kingdom
Belgium
United States
32,5
12,4
7,1
5,2
5,1
3,0
2,7
2,7
2,7
1,6
1º
2º
3º
4º
5º
6º
7º
8º
9º
10º
Exportações
Export
%
%
Portugal e
/
and
España
España
Portugal
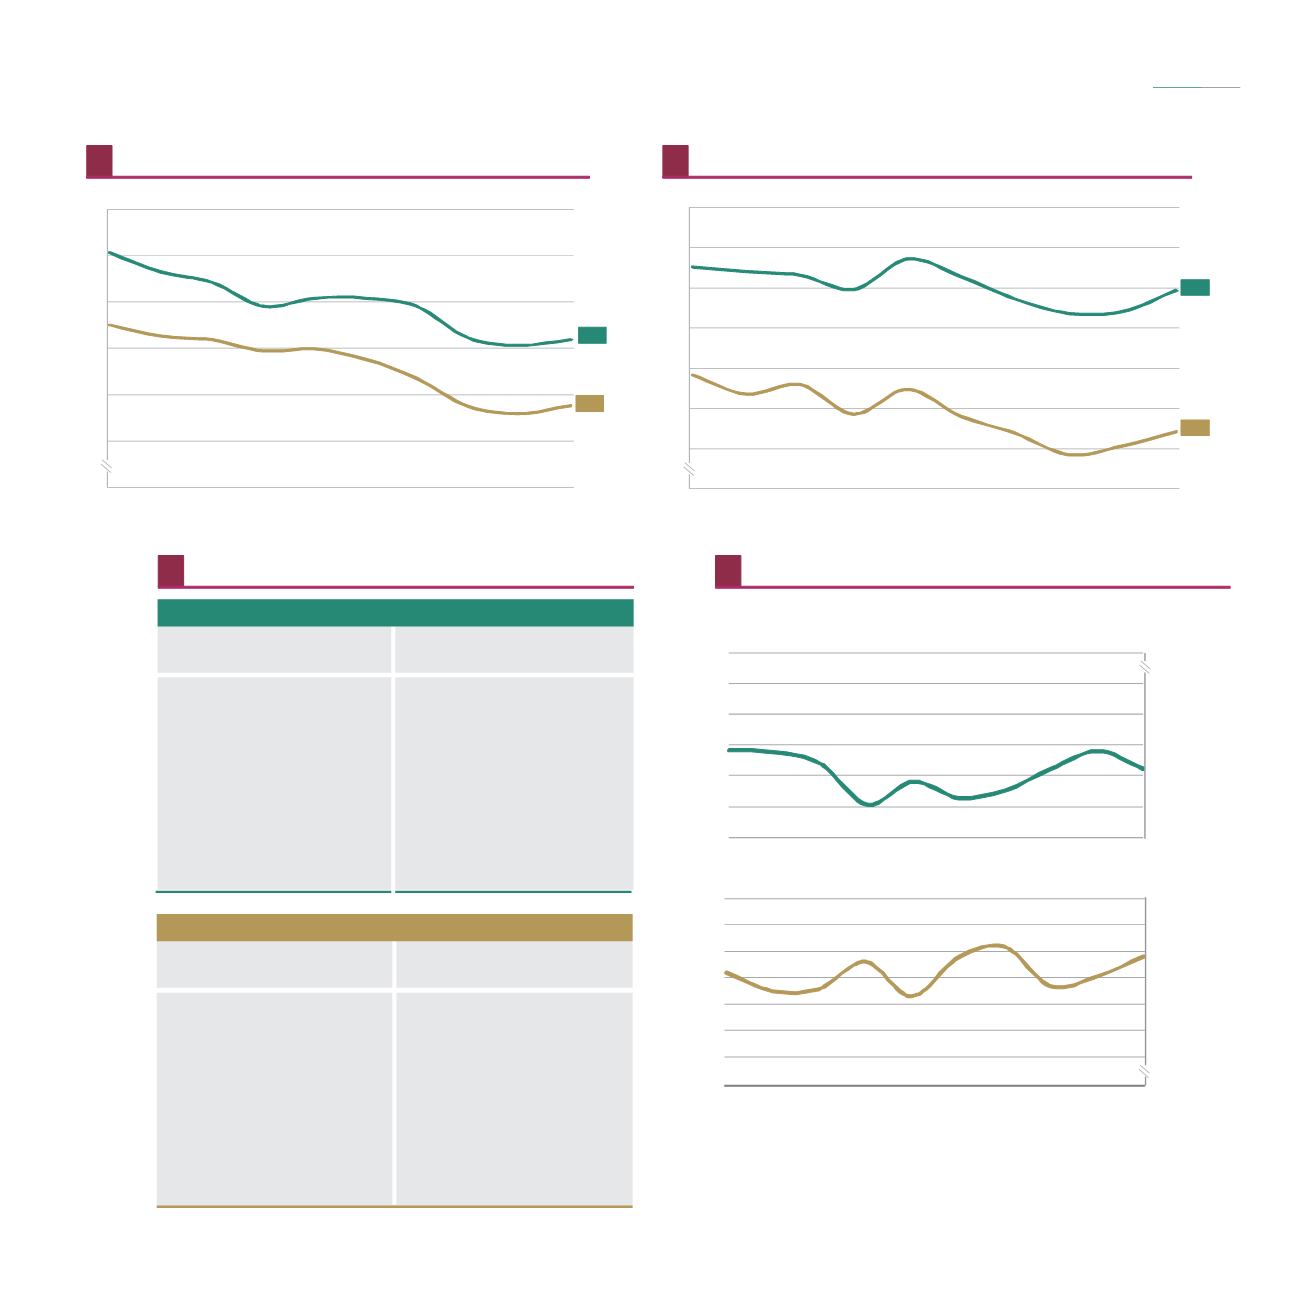
Comércio Internacional de Bens
International Trade in Goods
España
and
/
e Portugal
Exportações para a UE 28 no total das exportações, 2005-2014
Share of exports to EU 28 countries in total exports, 2005-2014
68
Importações da UE 28 no total das importações, 2005-2014
Share of imports from EU 28 countries in total imports, 2005-2014
69
70,9
63,8
60
65
70
75
80
85
2005 2006 2007 2008 2009 2010 2011 2012
2014
%
España
Portugal
74,7
57,1
55
60
65
70
75
80
85
2005 2006 2007 2008 2009 2010 2011 2012
2014
%
España
Portugal
Principais países parceiros, 2014
International trade - main partners, 2014
70
Saldo da balança comercial entre Portugal e Espanha, 2005-2014 (1000 milhões €)
1
Trade balance between Portugal and España, 2005-2014 (1000 million €)
1
71
-10,0
-9,0
-8,0
-7,0
-6,0
-5,0
-4,0
2005
2008
2011
2014
4,0
5,0
6,0
7,0
8,0
9,0
10,0
2005
2008
2011
2014
2013
2013
Fonte
/
: Eurostat
Source
1
As diferenças que se verificam entre os saldos resultam de especificidades da recolha de informação
relativa às transações Intra-UE de bens.
Differences between balances derive from issues on data collection from intra-EU goods transations.
Península Ibérica
The Iberian Peninsula
em números
2015
in figures
Índice
Index
Fonte
/
Source
: Eurostat
Fonte
/
Source
: Eurostat
Fonte
/
Source
: Eurostat
Importações
Import
Importações
Import