
-2,0
-4,0
-6,0
Contas Nacionais
National Accounts
[23]
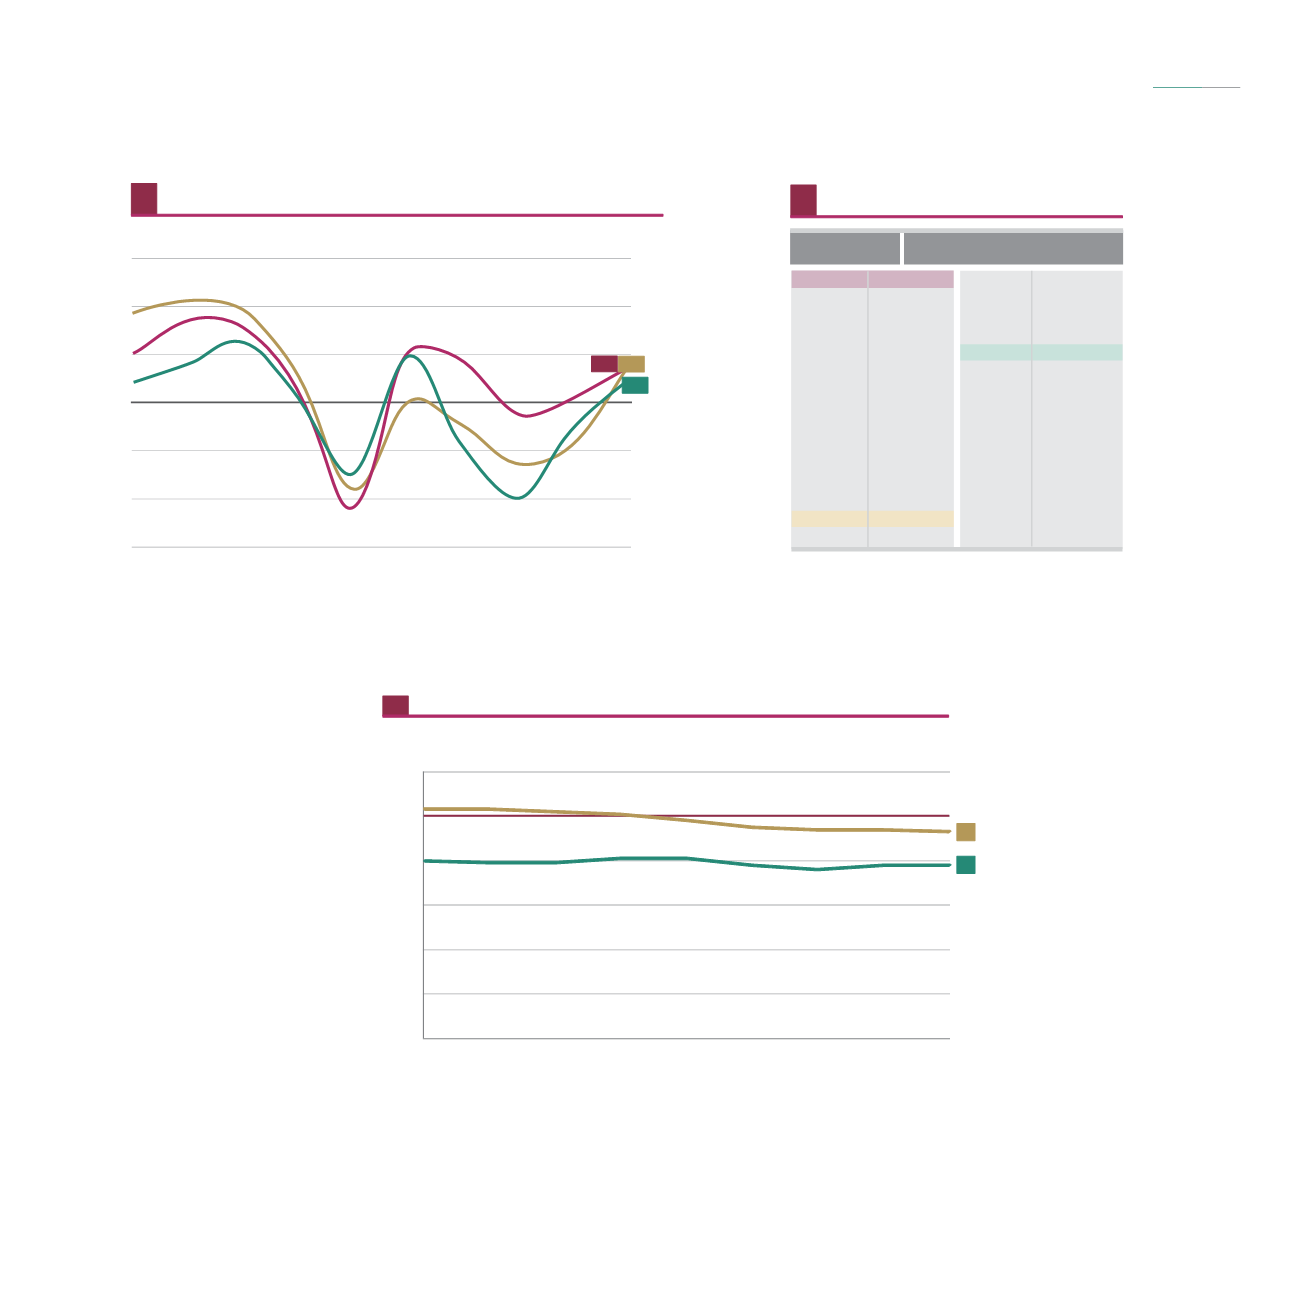
Taxa de variação anual do PIB a preços constantes (base=2011), 2005-2014
Real GDP growth rate on previous year at current prices (base=2011), 2005-2014
61
0,0
2,0
4,0
6,0
2005 2006 2007 2008 2009 2010 2011 2012
2014
%
España
1
Portugal
2
UE/ 28
EU
2014
PPS
UE/EU 28
ES
LU
IE
NL
AT
DK
DE
SE
BE
FI
UK
FR
IT
CY
100
93
263
132
130
128
124
124
124
119
110
108
107
97
85
MT
CZ
SI
SK
LT
EE
EL
HU
PL
LT
HR
RO
BG
PT
85
84
83
76
74
73
72
68
68
64
59
54
45
78
PIB per capita em PPS , 2014
1
GDP per capita in PPS , 2014
1
62
(p)
PIB per capita em PPS , 2006-2014
1
/
GDP per capita in PPS , 2006-2014
1
63
2013
1,4 1,4
Fonte
/
: Eurostat
Source
1
2
/
/
Dado estimado para 2014
Dados provisórios para toda a série
2014: Estimated
2005-2014: Provisional
Fonte
/
: Eurostat
Source
(p)
/
1
Paridades de Poder de Compra Padrão (UE 28 = 100)
Dado provisório
Purchasing Power Standards (EU 28 = 100)
Provisional
78
93
0
20
40
60
80
120
2006
2007
2008
2009
2010
2011
2012
2013
2014
PPS
UE/ 28=100
EU
España
Portugal
0,9
Península Ibérica
The Iberian Peninsula
em números
2015
in figures
Índice
Index
Fonte
/
: Eurostat
Source
1
Paridades de Poder de Compra Padrão (UE 28 = 100)
Purchasing Power Standards (EU 28 = 100)


