


 24 / 38

España
Portugal
UE/EU 28
2,8
Exportações - Importações
External balance of
goods and services
2,4
1,0
21,6
Consumo final
Administrações Públicas
Final consumption
expenditure of general
government
20,1
19,0
17,4
FBCF
(Investimento)
Gross capital
formation
18,2
15,4
58,2
Consumo final
Famílias e ISFLSF
Household and NPISH
final consumption
expenditure
59,2
64,6
Contas Nacionais
National Accounts
PIB: Agregados da despesa-Preços correntes, 2013 (%)
/
GDP and main components-Current prices, 2013 (%)
[24]
65
% PIB /
% GDP
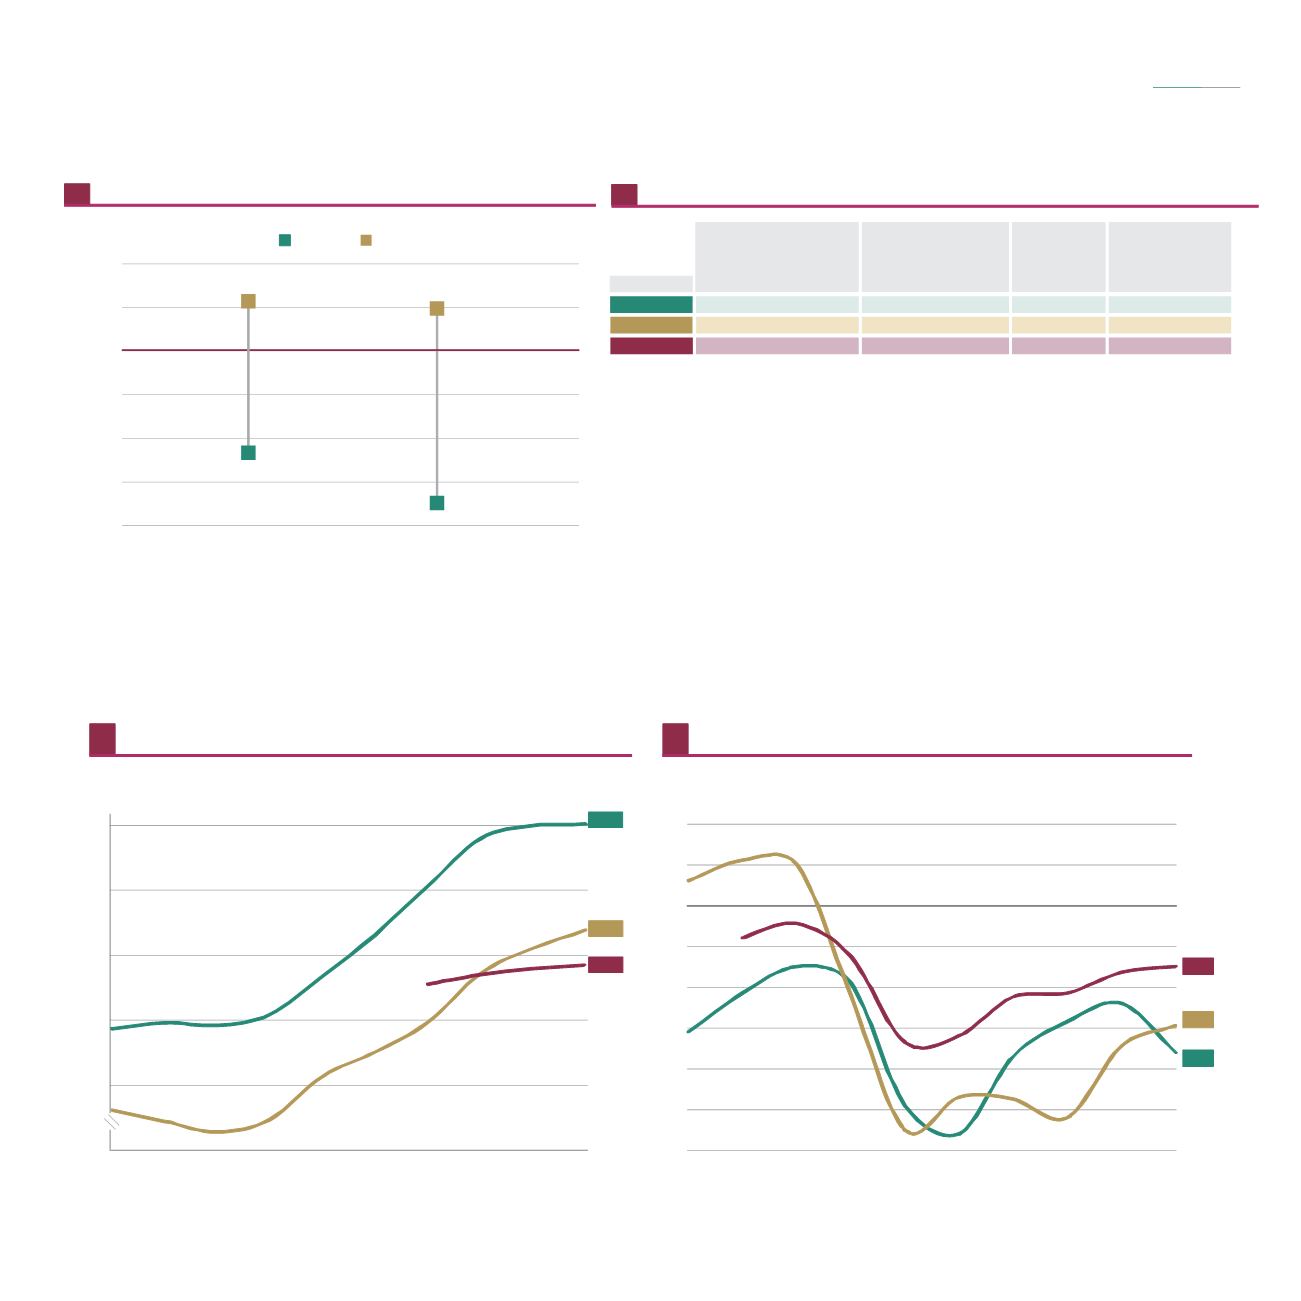
Indicadores de produtividade, 2014
/
Labour productivity indicators, 2014
64
60
70
80
90
UE/ 28 = 100
EU
110
120
Portugal
1
España
2
Produtividade (PIB/Emprego)
Nominal labour productivity
per person
Produtividade
(PIB ppc/horas trabalhadas)
Nominal labour productivity
per hour worked
Dívida das administrações públicas, 2005-2014
General government consolidated gross debt, 2005-2014
66
Excedente (+) / Défice (-) das administrações públicas, 2005-2014
General government net lending (+) /net borrowing (-), 2005-2014
67
UE/ 28
EU
Fonte
/
: Eurostat
Source
1
2
/
/
Dados estimados
Dados provisórios
Estimated
Provisional
Península Ibérica
The Iberian Peninsula
em números
2015
in figures
Índice
Index
Fonte
/
Source
: Eurostat
Fonte
/
Source
: Eurostat
130,2
97,7
86,8
España
Portugal
-7,2
-5,9
-3,0
-12
-10
-8
-6
-4
-2
0
2
4
2005 2006 2007 2008 2009 2010 2011 2012
2014
Portugal
España
50
70
90
110
130
2005 2006 2007 2008 2009 2010 2011 2012
2014
2013
2013
% PIB /
% GDP
UE/ 28
EU
Fonte
/
Source
: Eurostat